How do you know your robot got better? Part 2: measuring the evaluation
Companion to Part 1 — training a diffusion policy on a $300 arm from 0% to ~43%. This part is about the “~”. We set out to rank six model variants and ended up measuring our evaluation instead — at four levels, down to the physics of why two identical grasp attempts disagree 27% of the time. If Part 1 was about making the robot better, Part 2 is about how hard it is to know whether you did.
0. Setup, for readers arriving here first
- One SO-101 follower + leader, Raspberry Pi host, $60 fisheye wrist camera, wrist-only Diffusion Policy, task: “put the red block into the bin.” By the end of Part 1 we had six trained variants of the final recipe differing only in vision encoder configuration (from-scratch vs ImageNet-pretrained, GroupNorm vs BatchNorm, fine-tuning LR), cleanly ordered by validation loss, and we wanted to know which was actually best on the robot.
- Spoiler shape: every evaluation instrument we aimed at that question broke in an instructive way, and the instrument we finally built answered a different — better — question.
1. The noise hierarchy, discovered the hard way
- Level 1: the 15-placement grid. Our workhorse eval (5 placements x 3 regions, scored by hand) oscillated 7–9/15 across six model generations. We “diagnosed” each swing and shipped a data fix for it. At ~50% success, the binomial noise on 15 trials is ±1.9 — we were doing regression analysis on coin flips.
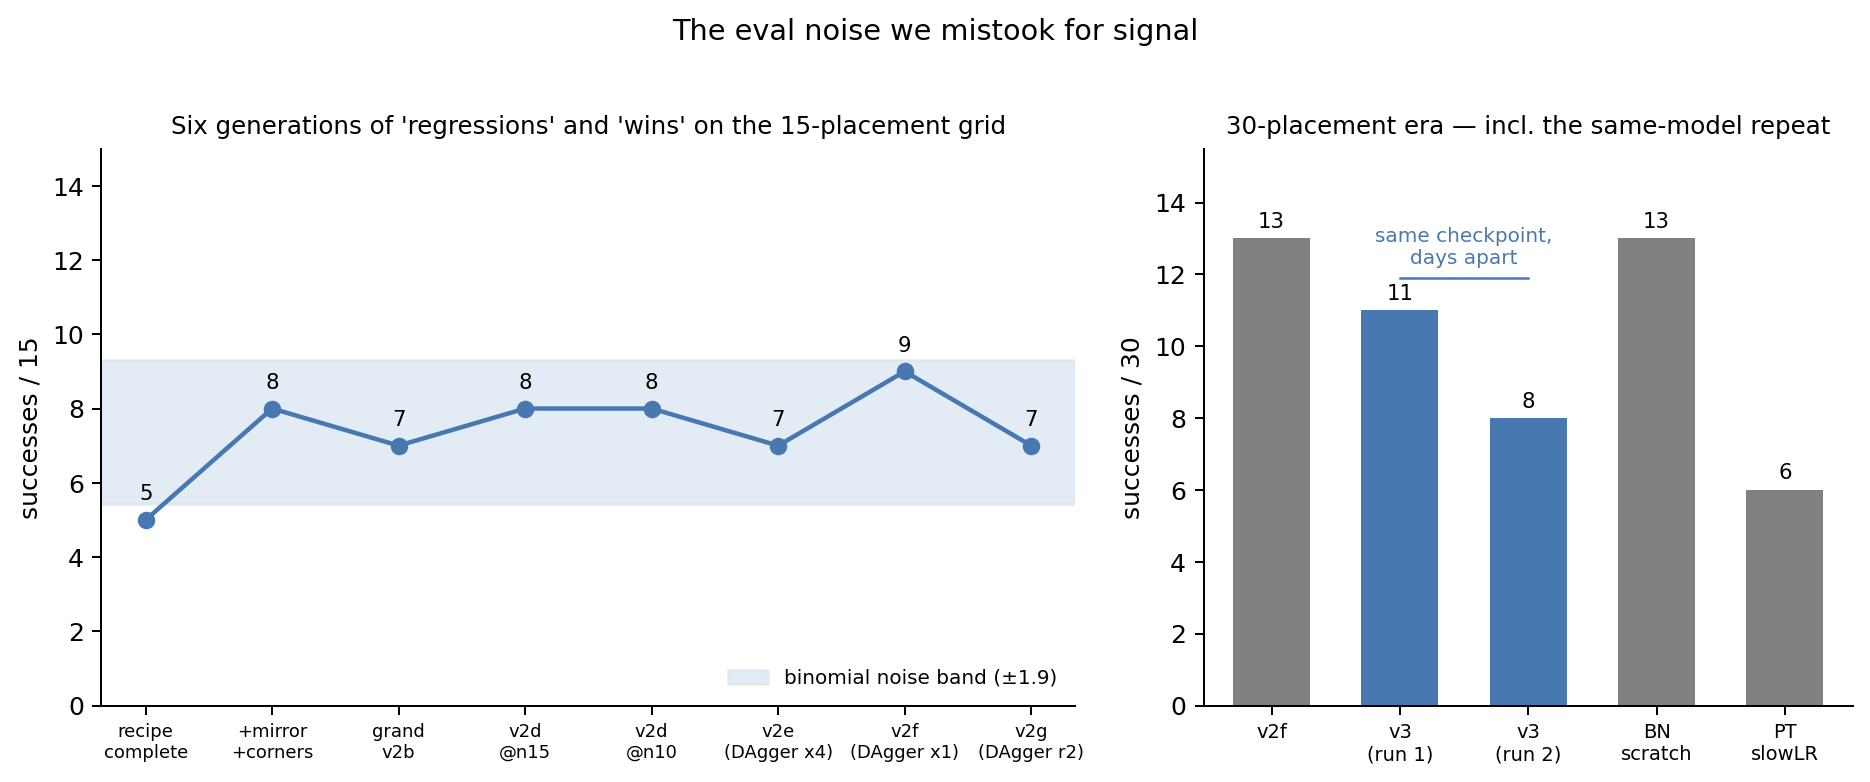
- Level 2: the 30-placement check. Doubling the grid deflated our champion from 9/15 (60%) to 13/30 (43%) — the high roll regressed on schedule.
- Level 3: the same-model repeat. The decisive humiliation: the identical checkpoint, re-evaluated on the same protocol days apart, scored 11/30 then 8/30. Nothing changed but time and dice. Almost every model comparison we had ever interpreted was inside this band.
- Level 4: the rig drifts. Transport-drop failures appeared in all sessions of one week and none of the earlier ones — across different models. Block edges wear, gripper pads polish, screws loosen. Cross-era comparisons carry environmental drift on top of sampling noise.
- Power math nobody wants to hear: resolving a 30%-vs-45% success gap at 80% power needs ~170 trials per model. By hand, at ~90 s per episode, that is a full day per model pair. The 30-trial grid can only resolve gaps of ≥ ~10/30.
2. Offline metrics — numbers you can compute without running the robot — do not resolve this
- The ABC report — Allshire et al., 2026, “Scalable Behavior Cloning with Open Data, Training, and Evaluation” — shows, with Pearson/Spearman correlations across training runs (their Figure 8), that training loss and validation action error — run the full inference chain on held-out demo observations and measure the error of the generated actions — correlate with real-world performance, while validation loss does not (for a diffusion policy, val loss is a noise-prediction objective, not an action comparison; theirs even rises during training while real performance improves). We implemented it faithfully: deploy-matched DDIM-10, fixed noise draws shared across checkpoints, and the paper’s caveat honored (diffusion step count held fixed, since fewer steps trivially lowers the error).
- Our first reading was that it failed: it ranked the model with our worst full-task grid score best. But that reading used the full-task grid as ground truth — and section 1 just spent four levels demonstrating the full-task grid is noise. Against the grasp benchmark (section 3), the picture partially reverses: action error’s top pick (the low-LR fine-tuned model) co-led the grasp table, while validation loss’s confident favorite finished mid-pack and its designated worst model (the naive full-LR fine-tune) co-led. Scored against our best behavioral instrument, action error called the winner and val loss called it backwards — though action error also ranked that same co-leading full-LR model dead last, so neither metric’s full ordering survives.
- The honest statement of what we can and cannot conclude at our noise floor: we cannot validate any offline metric’s fine-grained ordering (the grasp-rate differences among these models are themselves within overlapping confidence intervals). What we can say is that the two offline metrics disagree with each other, that validation loss’s ordering pointed the wrong way behaviorally, and that no slicing we tried — grasp-phase-only, transport-only, single-action-dimension (an idea independently published as Critical Interval MSE [arXiv:2606.29898]) — changed either metric’s verdict. Offline metrics measure reproduction of demonstrator actions on demonstration states; the failures that matter live in states the policy creates for itself.
- So what are offline metrics still good for? Less than we wanted to claim. Catching outright bugs, certainly — when we once evaluated checkpoints without their normalization preprocessor, val loss read ~3.45 instead of ~0.02, an unmissable alarm. But even “gross degradation” verdicts on real models proved unreliable: the naive full-LR fine-tune was flagged by every offline metric in every slicing (+14% val loss, +20% action error) — and then co-led the grasp benchmark. On this project’s evidence, an offline gap of even that size is a hypothesis about behavior, not a fact about it. Ranking near-peer models is certainly not among offline metrics’ powers — in either direction.
- Hygiene finding along the way: our val split had silently inherited 25% kinesthetic episodes — a modality we knew to be unlearnable for grasping — through five generations of dataset merges. It didn’t change rankings, but it diluted every val number we had ever reported. Check what your val set is actually made of.
3. Building an instrument that could actually measure: the grasp benchmark
- Diagnosis: full-task success compresses four distinct skills —
approach, grasp execution, transport, recovery — into one pass/fail
per 60–90 s episode. How those skills correlate across models is
unknown, and that’s precisely the problem: unless they happen to be
strongly aligned, a compound score can’t attribute a difference to
any of them at affordable trial counts. (The one hint we had pointed
the wrong way for compound scoring: our worst full-task model later
co-led the grasp test — within noise on both instruments, but hardly
reassurance that the skills move together.) The weakest link (the
grasp) is where outcomes are decided, so we built a unit test for it. Design elements,
each earned by a pilot failure:
- Rollout-seeded start states. A seeding policy (rotating per scene) rolls out normally; the operator presses SPACE the moment the block enters the gripper opening. The pose and the last two observations are captured, and the seeding rollout continues uninterrupted — becoming its own first trial. Start states are guaranteed on-distribution because a policy generated them.
- Ghost-overlay re-placement. For every subsequent trial the arm returns to the captured pose and the operator aligns the block to a 50/50 blend of live camera vs captured reference (plus a difference view that goes dark when aligned). Pixel-accurate re-placement, no table marks, no memory burden. Backlash means the background never quite aligns — aligning the block-to-gripper relationship is the policy-relevant thing, so that’s what the overlay optimizes.
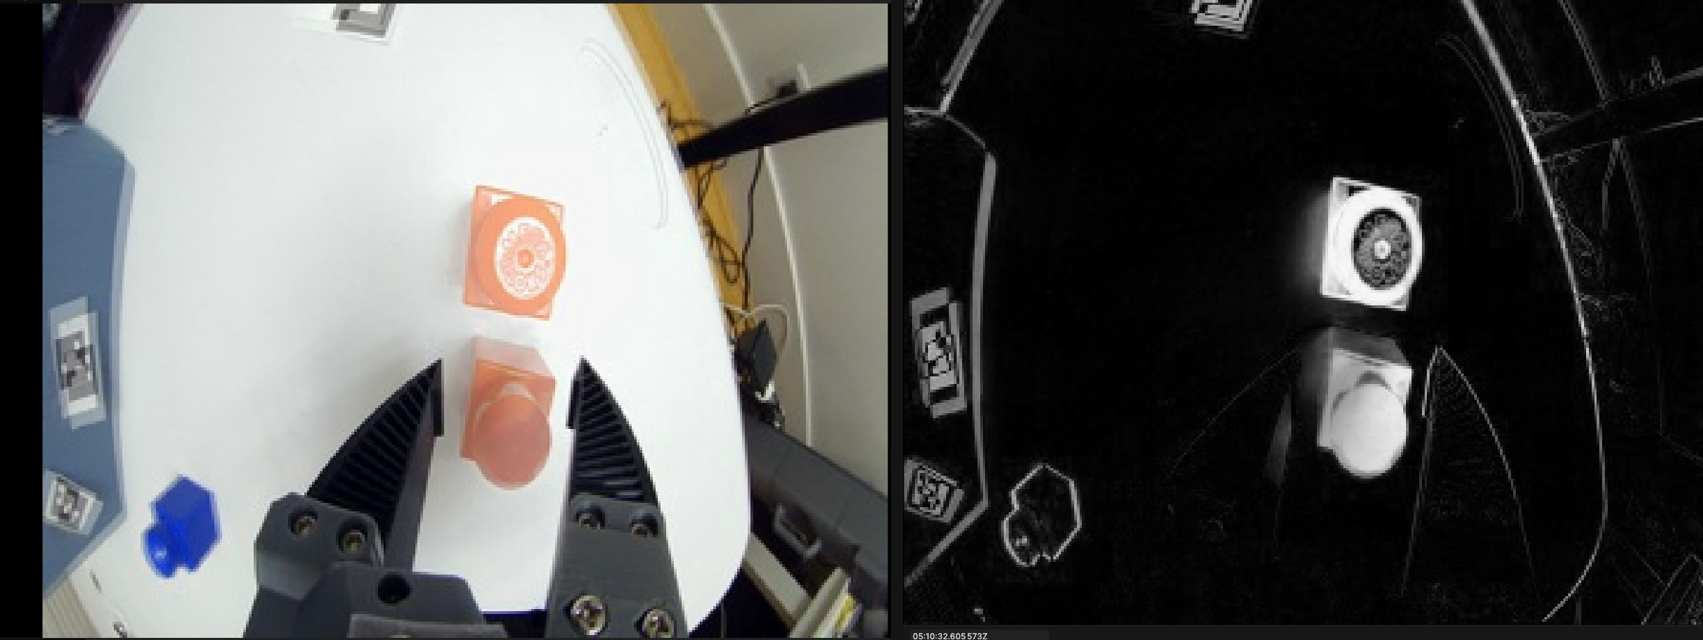
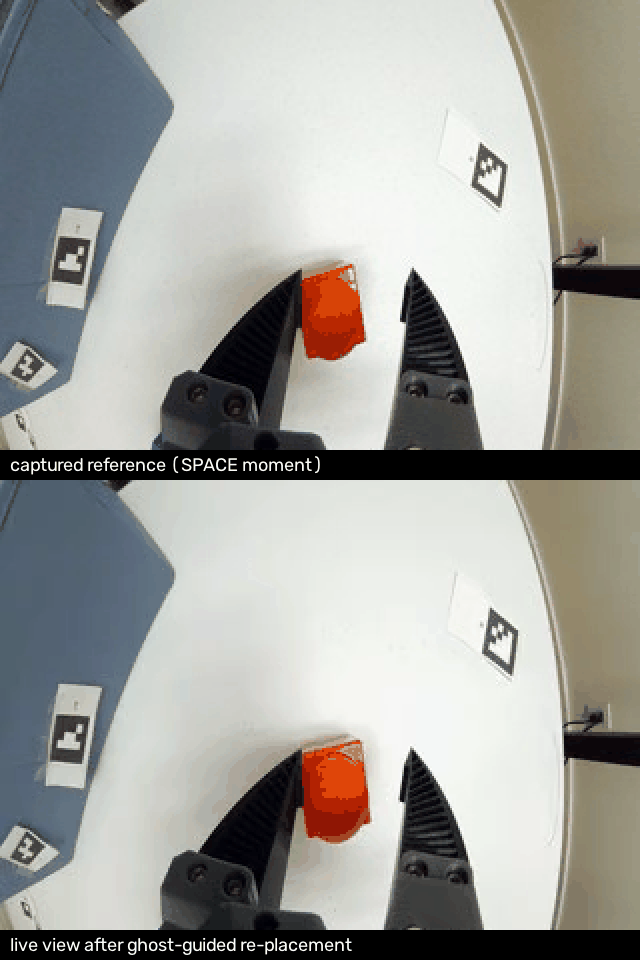
- Matched blocks, randomized order. Every model runs on every scene back-to-back in shuffled order, so placement variance and rig drift are shared, not confounded.
- A settled-grasp trigger, a scripted stress, and a human verdict. These policies close, reopen, re-angle, and reseat, so the trial ends on a settled grasp — 2.5 s of continuous closure (commanded or measured), flicker-tolerant — not on first contact. Then a scripted, policy-independent stress runs: lift, 4 s hold, pan jiggle, identical for every trial, so “grip quality” becomes an observable outcome instead of a judgment call. Scoring is a 3-level ordinal — 0 never held, 1 acquired but lost, 2 held through the stress — and every score was confirmed by the operator with a keypress. We tried auto-scoring from the measured gripper width (empty jaws close well past block width); it was not reliable enough to trust — edge grips read as empty, so the machine’s reading stayed a suggestion and the human stayed the judge.
- Calibration keys, resume, per-trial logs, and a fixed per-attempt rubric (“one attempt = one settled closure”) — details in the repo.
- The experiment shape: 6 checkpoints × 2 attempts per scene × 26 scenes = 280 scored trials (23 scenes fully complete across all six checkpoints; analysis equalizes to 46 trials per model). The six checkpoints, and why each earned its slot:
| checkpoint | what it isolates |
|---|---|
| GN_s1000 | the champion recipe (from-scratch + GroupNorm) |
| GN_s2000 | same recipe, different seed — the model-seed noise floor |
| GN_raw | the same training run as GN_s1000, raw instead of EMA weights — a pure EMA ablation |
| BN_scratch | from-scratch with BatchNorm — isolates normalization |
| PT_slowLR | ImageNet-pretrained, backbone at 10× lower LR — the DP paper’s prescription |
| PT_fullLR | ImageNet-pretrained, naive full-LR fine-tune — intended as the “should lose” control |
Two attempts per model per scene are what make the same-state flip rate (section 4) measurable at all.
The policy phase of one trial from the wrist camera: handoff at the captured state through settled grasp (6.5 s). Clips end at closure; the scripted stress follows.
- Throughput: ~25–35 s per trial including re-placement. 276 scored trials across 26 scenes in a few evening sessions — the trial count that the power math demanded and the full-task protocol could never afford.
4. The flip floor: 27%
- The benchmark’s headline wasn’t a model ranking. Across 139 same-model, same-scene trial pairs — identical weights, identical captured state, pixel-aligned block — 27% of pairs flipped outcome, almost always maximally: clean secure grasp on one attempt, complete miss on the other. We recomputed this rate as the session grew — ~30% after 6 scenes, 28% after 12, 27% after 26 — and it barely moved, while over the same growing dataset the model rankings changed story three times (section 5). The flip rate was the one statistic in the whole session that behaved like a measurement.
- Mechanism: approach is a visual-servoing attractor that absorbs micro-variation; the contact event is a bifurcation that amplifies it (which fingertip corner touches first, which side of the friction cone the block sits on — switching on sub-millimeter differences that backlash alone guarantees); and after contact this hardware is blind — no force, no tactile, position-commanded servos pushing open-loop. Smooth, then chaotic, then blind. 27% is what that pipeline structure measures out to.
- What follows from a 27% flip rate: on this hardware, no policy “can grasp” or “can’t grasp” — each attempt is a draw with some success probability, and the policy only controls what that probability is. So comparing policies means estimating probabilities, which takes many trials; watching a handful of attempts tells you almost nothing. And this is where the mysteries of section 1 came from: a 15-trial grid built on attempts that individually flip 27% of the time has to swing by a couple of successes between runs. The swings we spent weeks diagnosing were this coin flip, aggregated.
- The price list that follows (two-proportion test, 80% power): telling a 60% grasper from a 40% one takes ~100 trials per model — a single evening with this harness, if you compare just two models. A 15-point gap costs ~170 per model; a 10-point gap ~390; a 5-point gap ~1,550 (required trials grow as 1/gap²). Our own session spent 46 trials per model across six models — enough to resolve only ~29-point gaps, which is why it correctly refused to rank near-peers. Matched scenes discount these numbers somewhat (shared hard scenes cancel out), but the shape is the shape: on hardware with a 27% same-state flip rate, behavioral certainty is bought in hundreds of trials, not tens.
- Pre-registered prediction for the next chapter (written before the hardware exists): on a quasi-direct-drive arm, the same-state flip rate drops well below 27%. The mechanism decomposes into two halves, and the QDD platform attacks both. The unrepeatable state half: minimal gearing means minimal backlash (the source of the sub-millimeter pose lottery), output-side encoders make whatever slop remains visible instead of hidden behind motor-side readings, and CNC-milled links don’t flex under load the way printed plastic does. The blind after contact half: torque control means a wrong-footed contact yields instead of launching the block, and motor-current sensing gives the system a post-contact signal this arm never had. If the flip rate on the new arm doesn’t drop, our whole mechanistic story is wrong — that’s the point of writing the number down now.
5. Watching ourselves invent three wrong stories
- The benchmark also recorded, in time-lapse, what underpowered data does to careful people.
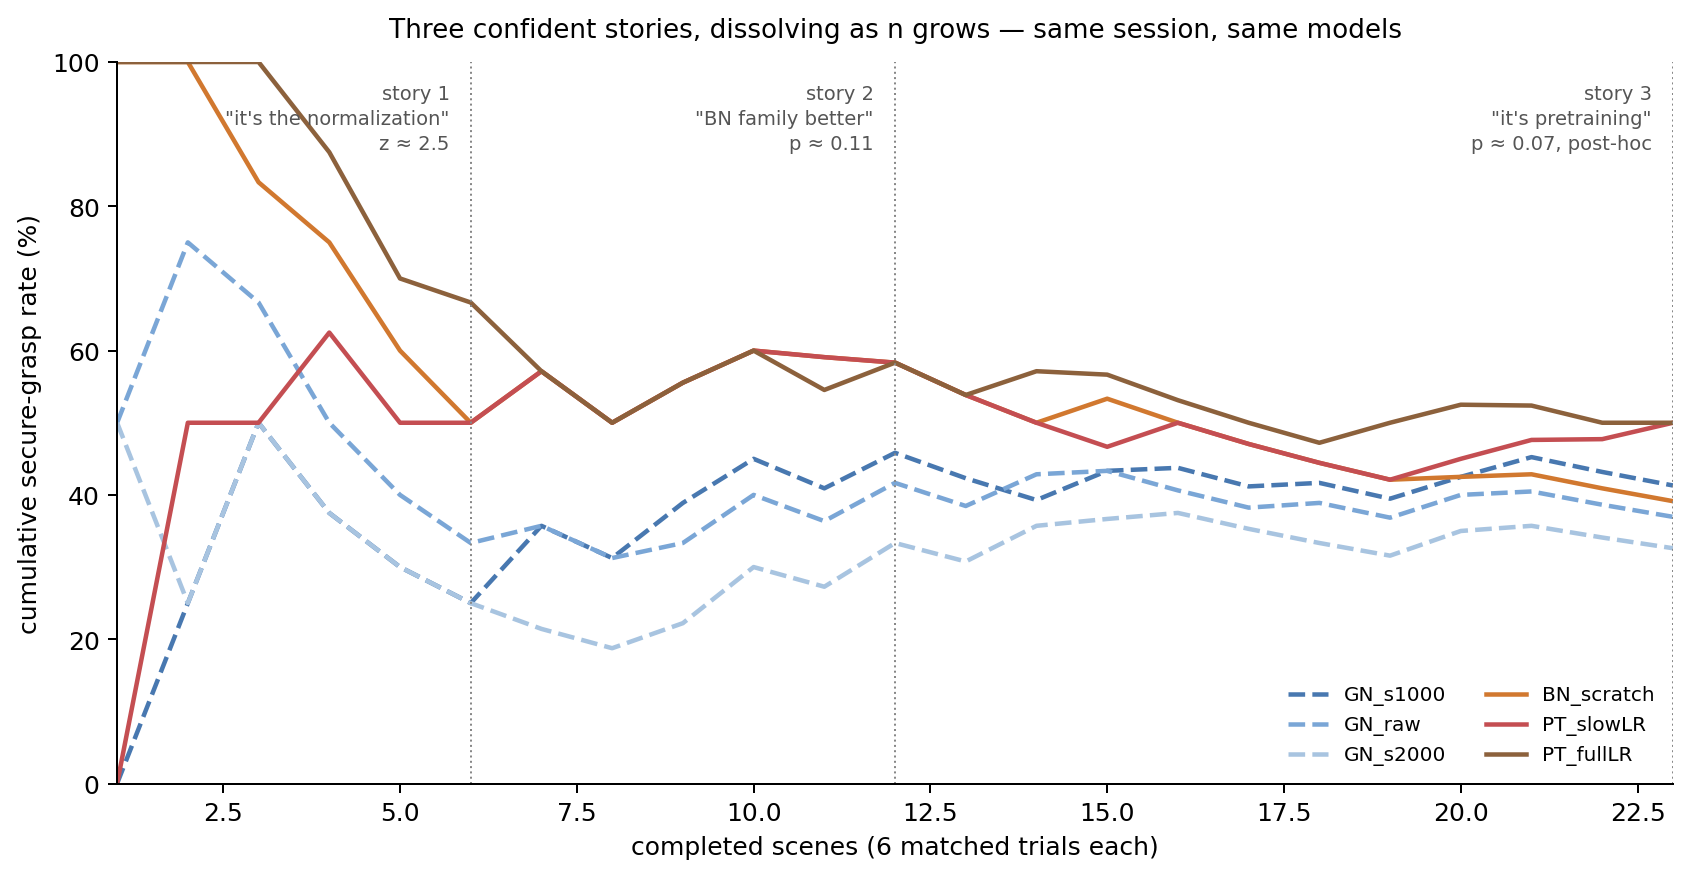
- 12 trials per model (6 scenes): all three BatchNorm variants above all three GroupNorm variants, pooled 57% vs 28%, z≈2.5. We drafted a normalization mechanism (EMA/BatchNorm-buffer interaction) with literature support.
- 24 trials per model (12 scenes): the BN-family gap softened to p≈0.11 but “held direction.” The story survived, upgraded with a phase-decomposition narrative.
- 46 trials per model (23 scenes): the family gap dissolved (p≈0.48; the first-half gap of +0.40 score points went to −0.05 in the second half), one model collapsed from 58% to 39%, and a different post-hoc grouping (pretrained vs from-scratch) now sat at p≈0.07. Story number three, adopted after seeing the data, one comparison among dozens examined.
- The three stories’ fates differ in kind, and it matters: stories one and two were falsified — more data from the same session killed them. Story three was never tested. An uncorrected p≈0.07 on a grouping chosen after looking at the data is exactly the shape of evidence that had already fooled us twice, so we ended the session declining to believe it rather than disproving it. If pretrained-vs-from-scratch grasp quality ever matters, it costs one fresh, pre-registered, two-model session (~100 trials each, per the price list above); until someone pays that, it is a hypothesis, not a finding.
- Every safeguard was in place — matched blocks, randomized order, pre-registered read-order, a positive control — and the stories formed anyway, because grouping-choice happens between the safeguards. Each story came with a plausible mechanism, and the mechanisms’ eloquence was uncorrelated with their truth (the AI assistant generated them fluently; see Part 1’s section on working with AI).
- What actually protected us, in the end: pre-committed read-order, a positive control whose misbehavior we eventually heeded, seed-pair entries (the seed pair, the raw/EMA pair) measuring the noise floor inside the experiment, and letting the trial count grow past the point where the story was exciting.
6. What survived, and the protocol we’d start with next time
- Findings that held at full rigor:
- The 27% same-state flip floor — the best-measured number the project produced.
- EMA: +9% validation loss, at every checkpoint, in the cleanest possible ablation (same run, two weight views) — and zero detectable grasp-behavior effect at 46 trials per model. Restore it (it’s free), but don’t expect it to rescue behavior.
- No encoder configuration separates at the grasp (33–50%, all CIs overlapping) — while validation loss orders the same six models decisively. Echoes the Diffusion Policy paper’s own fine print: “the best performance across different architectures is not large.”
- Underpowered evals generate confident, evolving, wrong stories — three of them, in one session, from us, with the receipts logged.
- The protocol we’d adopt from day one on the next platform:
- Same-model repeats first — measure the flip floor before comparing anything.
- Matched blocks with randomized within-block order; never compare across sessions without a bridge arm.
- Positive control in every session; if it misbehaves, suspect the instrument and the rig before inventing science.
- Unit-test the bottleneck phase (grasp) at high n instead of full-task at low n; keep full-task runs for existence proofs (recovery works; scanning appeared), which are immune to this whole essay.
- Pre-register groupings; anything discovered post-hoc buys a hypothesis, not a finding, and pays for its own fresh session.
- Where this leaves the headline number: Part 1’s “~43%” is honest precisely because the “~” is now a measured object — ±3/30 sampling, a 27% per-contact flip floor, and a rig that drifts by the week.
- Repo: github.com/YosubShin/lerobot_alohamini; harness: grasp_eval_so101.py; experiment logs: docs/experiments — every number above has a dated entry.